Integrated inverter algorithms for optimal performance
Integrated inverter algorithms for optimal performance
Steca inverters are equipped with a range of sophisticated functions that can be used to optimise solar system performance. Two of these are the ModuleScan and the ShadingScan.
• The ShadingScan automatically optimises solar power in case of shading
• The ModuleScan can be used for troubleshooting, diagnostics or feed-in improvements
ShadingScan: Optimal solar power even in the shade
Solar power systems require direct sunlight in order to deliver optimised yields. But even with carefully planned and constructed systems, some temporary shading is often unavoidable, for example due to dormers or other structures on the roof. In these cases, the ShadingScan function of the Steca inverters avoids unnecessary yield losses by quickly tracking to the current, actual maximum power point (MPP).
In order for a photovoltaic system to deliver the maximum yields, the inverter needs to continuously detect the maximum power of the connected modules. In technical jargon, this value is called the maximum power point (MPP). This depends on the current solar irradiation and therefore changes depending on the time of day and cell temperature.
The MPP is not usually determined for individual solar modules, but rather for a certain number of interconnected modules, also called a string. As long as the sun shines equally on all of the modules in a string, then there is only one unique maximum power. This can be detected by any modern inverter.
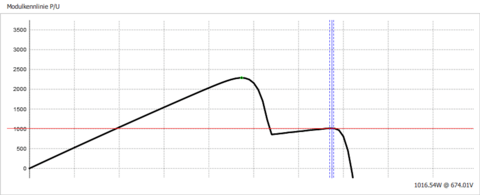
However, the situation changes if parts of a string are in the shade, which is a common occurrence in practice: Then there is not just one, but several MPPs. In this case, conventional inverters are no longer able to select the optimal MPP. The result: noticeably less solar power is generated than is possible.
coolcept fleX: Unbeatable price
In these kinds of situations, the Steca ShadingScan algorithm ensures that the inverter can determine the actual maximum power of the solar system and therefore maximise the production of solar power. To make this possible, the inverter performs checks at regular intervals to determine whether the current MPP is correct or if it is possible for a higher power value to be achieved. This ensures that optimised power is always available without the need for any additional technology or investments.
ModuleScan: Integrated diagnostics, troubleshooting and optimisation
Just like the ShadingScan, the ModuleScan serves to reduce unnecessary yield losses in the photovoltaic system. Compared to the ShadingScan, however, it enables a more comprehensive analysis and also serves to detect contamination and defects. However, it is more time-consuming in comparison. This is why, unlike the faster ShadingScan – which is permanently active in the background, it must be initiated individually by the operator.
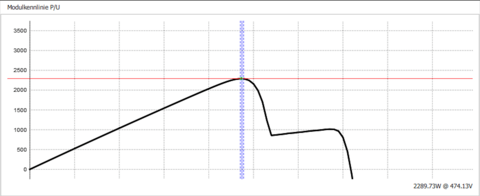
Like the ShadingScan, the ModuleScan analyses the characteristic curve of interconnected solar modules. The goal here is also to identify the ‘global’ MPP with the highest power (see explanation above).
However, while the ShadingScan only checks a certain part of the solar system characteristic curve in order to continuously and gradually optimise everyday operation, the ModuleScan always runs through and analyses the entire characteristic curve. This is why it can be used in a particularly versatile way: Not only can the point of maximum power be determined with the help of the characteristic curve, but the course of the line also provides system operators and installers with valuable insights into the condition of the solar system.
For example, operators can use the characteristic curve to see whether the system has become so dirty that it should be cleaned. If, on the other hand, the system is clean and not in the shade, the characteristic curve can show that individual modules are damaged.


